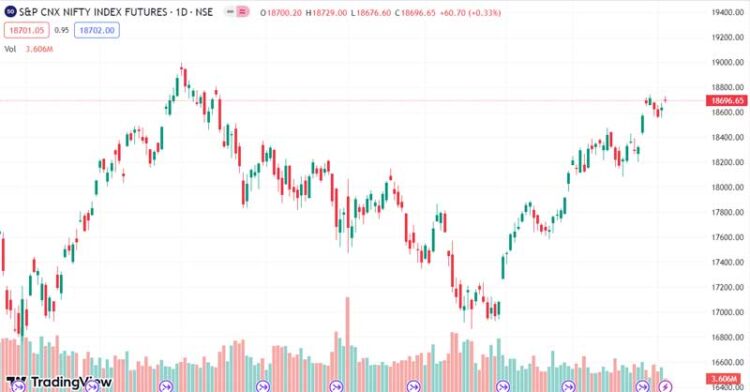
The Nifty50 index has been showing remarkable strength in recent times, fueling speculation among analysts that the benchmark index is poised to reach new record highs in the coming sessions. While some analysts predict that the Nifty may surge past the 18,900 mark and even breach key psychological levels of 19,000, others suggest that achieving new highs may require a bit more time. In this article, we will explore the factors influencing the Nifty50 index and delve into the expert opinions of analysts.
NSE’s Barometer and Recent Performance
On Monday, the NSE’s barometer hit 18,640, buoyed by positive global cues, before relinquishing some of its gains. The index had previously reached its 52-week high of 18,887.60 on December 1, 2022, but subsequently entered a corrective phase. Despite this setback, the index has shown a notable uptrend, with a 3% increase in the past month and a 6% surge over the last three months.
Strong Market Indicators and Positive Sentiment
Currently, around 80% of Nifty 50 stocks are above their 200-day moving average (DMA), a significant improvement compared to the previous two weeks’ average of 76%. Foreign institutional investors (FIIs) injected $1,004 million into the market last week, surpassing the $850 million inflow of the previous week. On the other hand, domestic institutional investors (DIIs) withdrew $196 million, in contrast to the $421 million inflow of the preceding week, as reported by Nuvama Institutional.
The market’s upward momentum can be attributed to strong FII buying, positive earnings from Indian companies, and favorable global cues. These factors have counteracted concerns regarding inflation and recession, providing a fundamental basis for the market’s upward trajectory.
Technical Analysis and Support Levels
From a technical perspective, the Nifty50 index has shown strength following a consolidation phase, demonstrating respect for key support levels on the charts. Last week, the index displayed a choppiness due to uncertainty surrounding the US Debt ceiling. On the weekly timeframe, the benchmark index traded within a range of 197 points, with immediate resistance near 18,600 and immediate support at 18,458, as identified by BP Equities.
Although the price action at the end of the week did not show a clear directional bias, it formed an inside bar, indicating volatility compression. Analysts anticipate the index will resume its upward movement towards all-time highs, provided the support zone of 18,460-18,300 remains intact. Key resistance levels in the near term are expected to be at 18,660-18,887.
Sector Performances and Broader Market Trends
In the past week, the Nifty Pharma index recorded a surge of approximately 3%, closely followed by strong gains in the Nifty PSU Bank index. Broader market indices also outperformed their headline counterparts, with the Nifty Midcap 100 index up by about 2% and the Nifty Smallcap 100 index gaining more than 3%. Consequently, the India VIX, a measure of market volatility, eased by about 9% to 11.2 levels.
IIFL Securities predicts that the Nifty 50 will find support at higher levels, with the relative strength index (RSI) continuing to show strength despite a dip in momentum indicated by the moving average convergence divergence (MACD). Short-term support is expected around the previous high of 18,430 levels, while resistance may be encountered at 18,700 levels.
Moreover, the Nifty Midcap 100 index has broken out of a long-term consolidation pattern, establishing a new all-time high. Although the RSI remains in overbought territory, this often indicates the beginning of a sustained up-move. IIFL maintains a bullish but cautious stance for the short-term, given the rapid rally witnessed in the index.
Sector-wise Performance and Outlook
Over the past month, the Nifty Midcap 100 and Nifty Smallcap 100 indexes have surged by up to 7% each, while the Nifty IT index has gained 6%. The Nifty Auto index has witnessed a substantial surge of over 10%, and the Nifty Realty index has jumped by more than 9%. The Nifty IT, FMCG, and Media indices have each experienced a 6% increase, while the Nifty Bank index has gained 4%.
Weekly Chart Analysis and Projected Range
Analyzing the weekly chart, it is evident that the index has formed a bearish candle with a higher high-low formation, indicating a positive bias. However, this candle also suggests a pause after a strong rally. The chart pattern indicates that if the Nifty crosses and sustains above the 18,700 level, it would likely witness buying interest, propelling the index towards the range of 18,900-19,000 levels, as stated by Axis Securities.
Conversely, a break below the 18,450 level would trigger selling pressure, potentially driving the index towards the range of 18,300-18,200. For the upcoming week, a mixed bias is expected, with the Nifty likely to trade within the range of 19,000-18,200. The weekly strength indicator, RSI, remains above its respective reference lines, indicating a positive bias.
Expert Opinions and Recommendations
Based on various timeframes, Nifty patterns suggest that a bearish candle on the weekly chart may indicate a continuation of the bearish trend towards the pivotal support level around 18,400, according to SMIFS Research. However, they recommend a buy-on-dips strategy as long as the 18,400 support level remains intact.
To summarize, the Nifty50 index has exhibited strong performance and has the potential to reach new record highs in the near term. Market indicators, positive sentiment, and technical analysis support this notion. Nevertheless, cautious optimism and consideration of sector-wise performances are advisable when making investment decisions.
Please note that the recommendations, suggestions, views, and opinions provided by the experts are their own and do not reflect the opinions of eNews Reporter and BusinessToday.
Source: BusinessToday


